
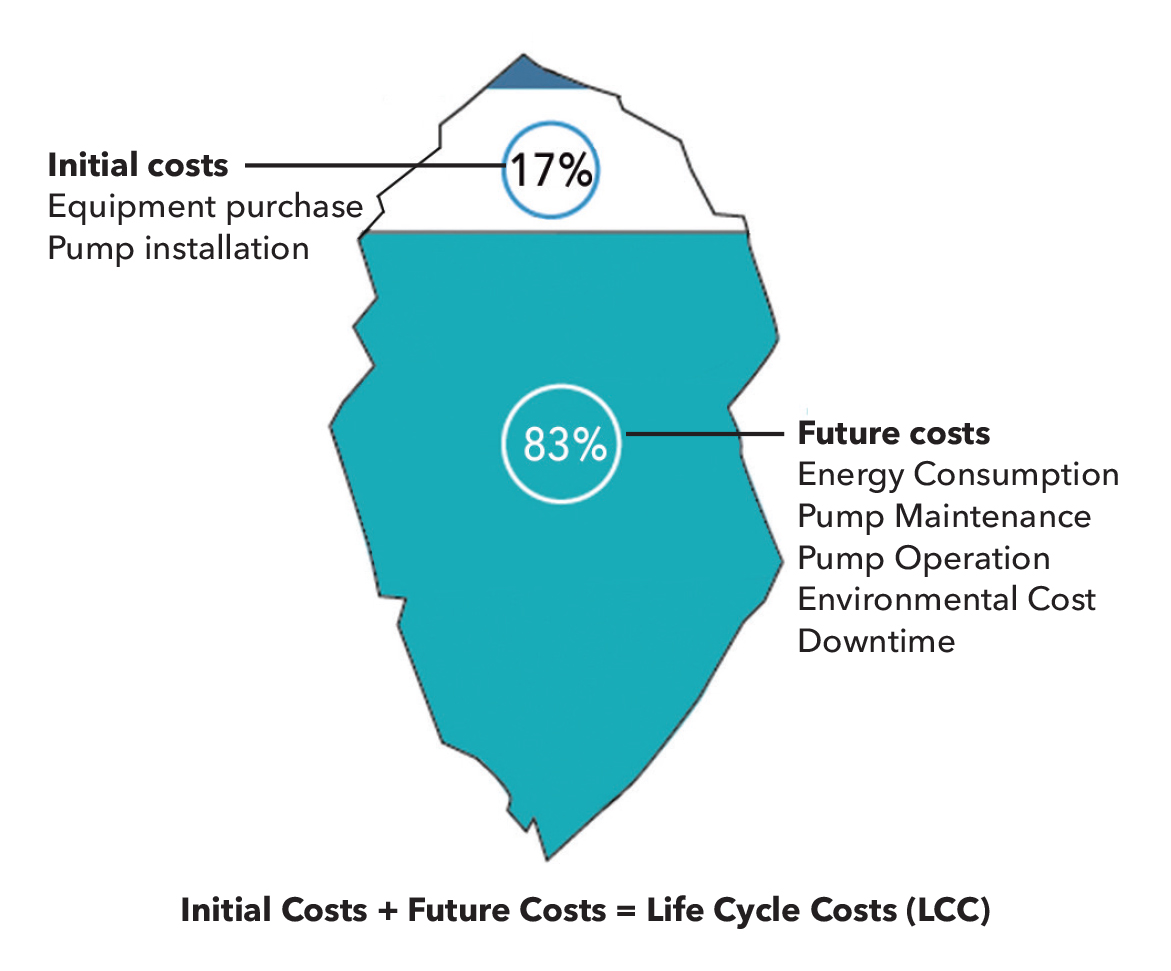
When making project funding decisions under constrained budgets, it is tempting to think in the short-term. Long-term planning is beneficial; project managers and policy-makers need to think more strategically about how to operate and maintain these systems.
Pumping systems account for nearly 20% of the world’s electrical energy demand and range from 25 to 50% of the energy used in industrial plant operations. Pumping systems are used in a wide range of applications. They provide domestic, commercial and agricultural services; municipal water and wastewater services; and industrial services for food processing, chemical, petrochemical, pharmaceutical and mechanical industries.
Although pumps are typically purchased as individual components, they supply water only when operating as part of a system. Choice of materials and the amount of energy used by a system depend on pump and installation design, and the way the system is operated. These factors are interdependent; they must be carefully matched to each other and remain so throughout their working lives.
As the focus of funding in the commercial buildings market shifts toward system preservation, a greater use of analysis that takes into consideration both short- and long-term costs can ensure the sustainability of future budgets and a better management of our vital infrastructure.
In an effort to construct projects within limited capital budgets, high importance is often given to up-front costs, with little attention to future costs.
Product life cycle cost
The concept of Product Life Cycle Cost (PLCC) was first used in in the mid-1960s by the United States Department of Defense to support decisions in relation to tender selection for military procurement. Life cycle thinking was then adopted by the United States Department of Health, Education and Welfare in 1976, with a project titled ‘Life cycle budgeting and costing as an aid in decision making’. In general, the public sector has been a relevant promoter for life cycle cost (LCC) calculations, while other industries followed more slowly.
The U.S. Department of Energy Order (DOE O) 413.3B defines LCC as “the sum of all direct, indirect, recurring, nonrecurring, and other related costs incurred in the planning, design, development, procurement, production, operations and maintenance, support, recapitalization, and final disposition of real property over its anticipated life span for every aspect of the program, regardless of funding source.”
Life cycle cost analysis
LCC analysis is a management tool that can help companies minimize waste and maximize energy efficiency for many types of systems, including pumping systems. In fact, a complete understanding of all the contributions that make up the total cost of a system throughout its lifespan will provide an opportunity to dramatically reduce energy, operational and maintenance costs, leading to important environmental benefits.
The process used to conduct LCC analysis comprises those tasks that enable a comparative investigation of competing projects or program alternatives. The process begins with developing an LCC estimate for each alternative, generally including all costs for every project phase. The goal is to find the best value solution by linking each alternative to how it satisfies a strategic objective. The analysis should be unbiased by considering all practical alternatives and should not be developed to support a particular solution. It should also be rigorous enough so independent auditors can review it and clearly understand why a particular alternative was chosen.
In addition to supporting an investment decision, the LCC analysis should be considered a living document and updated often to reflect changes in scope, schedule or budget. In this way, the process becomes a valuable tool for continuous evaluation of how to sustain or enhance an enterprise through ongoing value engineering assessments.
Implementing LCC methods
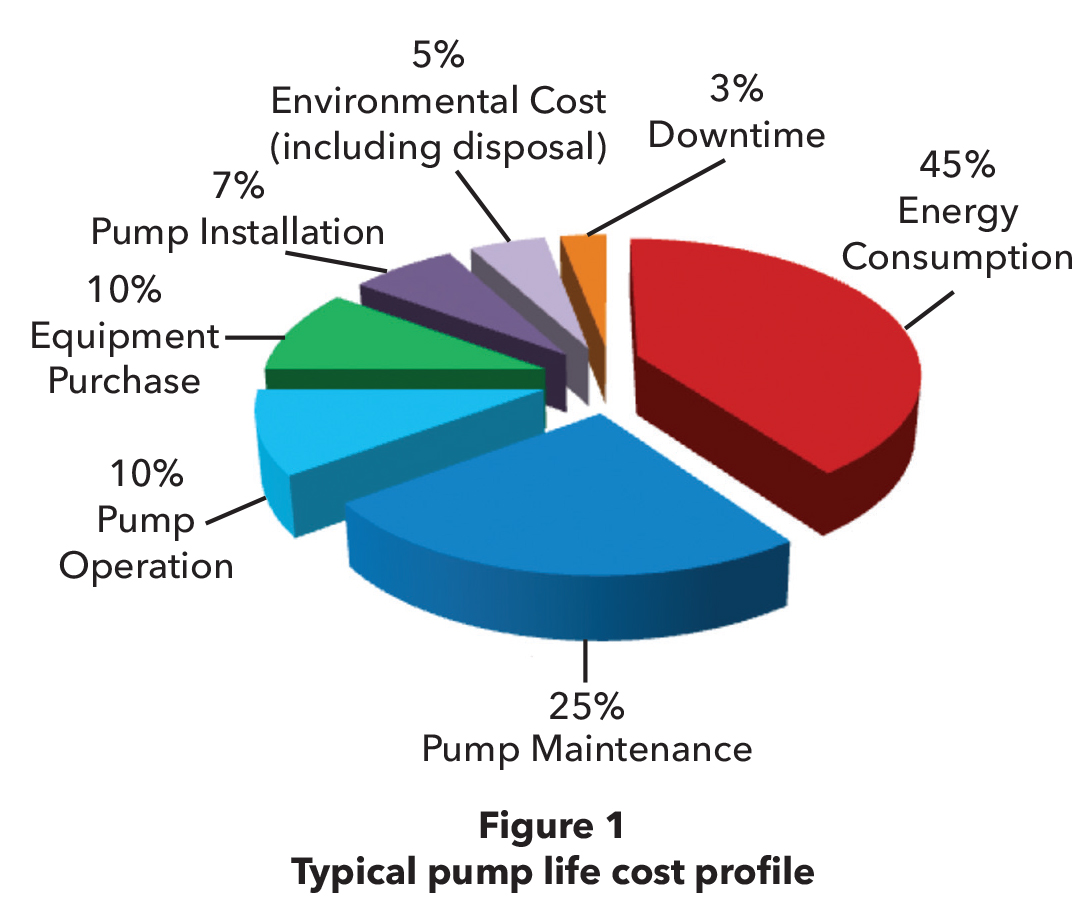
Existing systems provide greater savings opportunities for the use of LCC methods than new systems for two reasons: first, there are at least 20 times as many pump systems in the installed base as are built each year; and, second, many of the existing systems include pumps or controls that are not optimized. This is due to the fact that pumping tasks change over time, requiring systems to be constantly updated or even redesigned in order to meet a variable demand. For a majority of facilities, the energy and/or maintenance costs represent the major part of the LCC (see Figure 1). Because of this, it’s important to determine the current cost of energy, expected annual energy price increases, and anticipated maintenance costs for life of the system. Other elements, such as downtime cost, decommissioning time and environmental costs should also be estimated and can often be determined based on historical facility data. Depending on the typology of processes performed in the facility, downtime costs can be more significant than the energy or maintenance components of the equation, making productivity loss from downtime an important consideration.
When applying the LCC methods, the first step is to understand and analyze each element of the LCC equation, determining a realistic value for use in computing the total life cost. It should be noted that the LCC calculation does not include the cost of raw materials consumed by the plant in making a product.
Elements of the LCC equation:
LCC = Cic + Cin + Ce + Co + Cm + Cs + Cenv + Cd
LCC = life cycle cost
Cic = initial costs, purchase price (pump, system, pipe, auxiliary services)
Cin = installation and commissioning cost (including training)
Ce = energy costs (predicted cost for system operation, including pump driver, controls, auxiliary services)
Co = operation costs (labour cost of normal system supervision)
Cm = maintenance and repair costs (routine and predicted repairs)
Cs = downtime costs (loss of production)
Cenv = environmental costs (disposal of contaminant liquids and contaminated used parts, such as seals)
Cd = decommissioning/disposal costs (including restoration of the local environment and auxiliary services).
The pump system designer or the plant manager needs to obtain separate data showing the performance of each pump/system considered over the output range. Performance can be measured in one of two ways: overall efficiency of the pump unit, or efficiency of the system at different output levels. Driver selection and application will affect energy consumption. For example, a control system sensing output changes may generate a constant energy load, whereas a motor driven by a variable speed drive may consume different amounts of energy at different operating settings. The use of a throttling valve, pressure relief, or flow by-pass for control will reduce operating efficiency and increase the energy consumed.
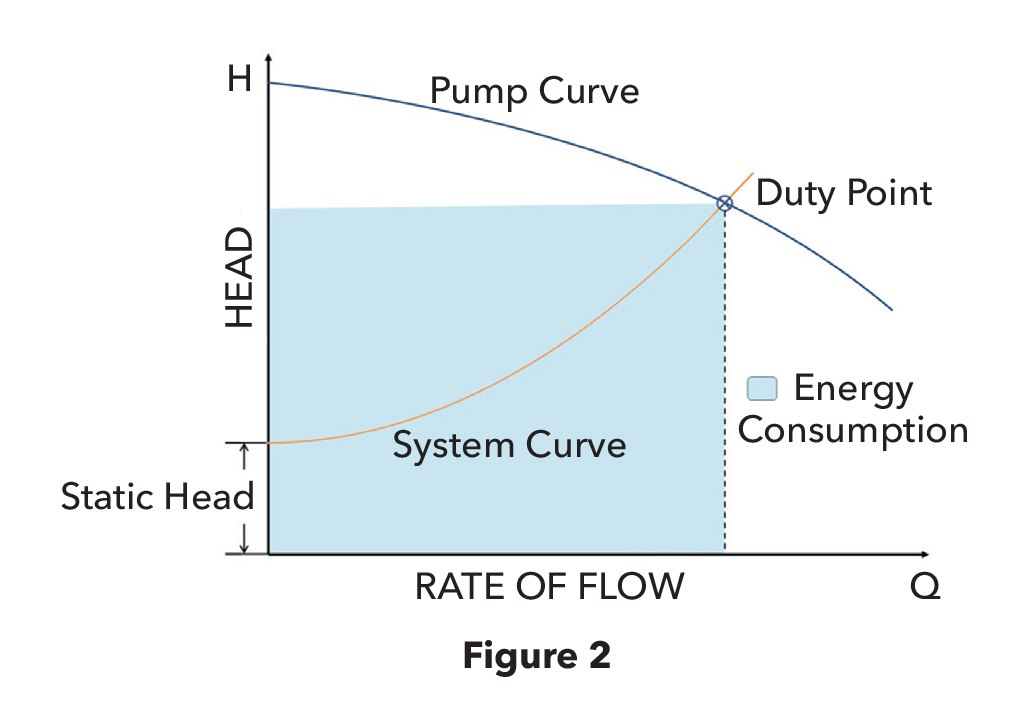
Energy consumption should be plotted on the same time base as the usage values to show their relationship to the usage pattern. The area under the curve then represents the total energy absorbed by the system being reviewed over the selected operating cycle. The result will be in kilowatt-hours (kWh). If there are different power costs at different loads, then the areas must be totaled within these loads. Once the charge rates are determined for the energy supplied, they can be applied to the total kWh for each charge band (i.e., rate period). The total cost of the energy absorbed can then be found for each system under review and plotted against the same time period.
Finally, energy and material consumption costs of auxiliary services should be included. For example, the cost of running a cooling circuit using water would include the following: cost of the water (supply), booster pump service, filtration, circulation and heat extraction/dissipation.
Co: Operation costs
Operation costs are labour costs to operate a pumping system. These expenses vary widely depending on the complexity and duty of the system. For example, a hazardous duty pump may require daily checks for dangerous emissions, reliability and performance within certain parameters. A fully automated non-hazardous system may only need limited supervision. Regular observation of how a pumping system is functioning can alert operators to potential losses in system performance. Performance indicators include changes in vibration, shock pulse signature, temperature, noise, power consumption, flow rates and pressure.
Cm: Maintenance and repair costs
Obtaining optimum working life from a pump requires regular servicing. The manufacturer will advise the user about the frequency and the extent of this routine maintenance, the cost of which depends on the time and frequency of service and the cost of materials. The design can also influence these costs such as the materials of construction, components chosen and ease of access to the parts to be serviced. Major maintenance activities may require moving the pump offsite. Downtime can lead to reduced production, and/or cost to lease a temporary replacement. These costs can be minimized by programming major maintenance during annual shut-down or process change-over periods.
The total cost of routine maintenance is found by multiplying the costs per event by the number of events expected during the pump’s lifetime. Although unexpected failures cannot be predicted, they can be estimated statistically by calculating mean time between failures (MTBF). MTBF can be estimated for components and then combined to give a value for the machine.
Another option is to consider the shortest likely life and the longest likely life of the equipment. In many cases, historical plant data is available. Whenever available, historical data is preferable to theoretical data from the equipment supplier. The cost of each event and the total costs of these unexpected failures can be estimated in the same way that routine maintenance costs are calculated.
Cs: Downtime and loss of production costs
The cost of unexpected downtime and lost production is highly dependent on the system design; however, despite design or target life of a pump, there will be occasions when an unexpected failure occurs. Downtime can be a significant factor in the total LCC, rivaling energy and replacement parts costs in its impact. In cases where the cost of lost production is unacceptably high, a spare pump may be installed in parallel in the same system, ready for operation. In case the first pump needs to be serviced, the spare pump (also known as redundant or backup pump) can immediately take over, offering the same performances and mitigating the risk of downtime costs. If a spare pump is used, the initial cost will be greater but the cost of unscheduled maintenance will include only the cost of the repair.
Cenv: Environmental costs, including disposal of parts and contamination from pumped liquid
The cost of contaminant disposal during the lifetime of the pumping system varies depending on the nature of the pumped product. Certain elements such as the materials or technology used can reduce the amount of contamination, but usually at an increased investment cost. Examples of environmental contamination can include: cooling water and packing box leakage disposal; hazardous pumped product flare-off; used lubricant disposal; and contaminated used parts, such as seals. Costs for environmental inspection should also be included.
Cd: Decommissioning/disposal costs, including restoration of the local environment
Typically, the cost of pumping system disposal will vary little across designs. This is true for non-hazardous liquids and, in most cases, for hazardous liquids. Toxic, radioactive, or other hazardous liquids will have legal environmental requirements, which will be largely the same for all system designs. Decommissioning differences may occur if a system has disposal arrangements as part of its operating plan versus a system with disposal activities that are not. For example, a hygienic pump designed for cleaning versus one that must be removed before cleaning. Similar parameters can be applied to local environmental restoration costs. When disposal is very expensive, the LCC becomes much more sensitive to the useful life of the equipment.
Total life cycle costs
Estimated costs for the elements that comprise the total LCC must be aggregated to enable comparison of the designs under consideration. The best way to do this is to tabulate each item and its value. Explanations should be provided when no value is entered. The estimated costs can then be totaled to give the LCC values for comparison, including non-qualitative evaluation factors.
Other monetary factors to consider in developing the LCC include:
• Present energy prices.
• Expected annual energy price increase (inflation) during the lifetime of the pumping system.
• Discount rate, to adjust past and future benefits/costs to inflation and make them time-equivalent.
• Interest rate.
• Expected equipment life (calculation period).
In addition, the user must decide other costs to include, such as maintenance, downtime, environmental and disposal.
Pumping system design
System design is key to minimizing LCC because it considers the interaction among components and the calculation of the operating duty point(s). Proper system design not only reduces LCC, it maximizes efficiency. For example, pipe diameter must be calculated according to the flow and pressure generated by the pump(s), but it must be properly sized because operational costs are directly dependent on piping diameters.
Piping diameter is selected based on the following:
• Economy of the whole installation, so that the total cost for pumps, piping system and pumping costs is a minimum.
• Required lowest flow velocity for the application (e.g., avoid sedimentation).
• Required minimum internal diameter for the application (e.g., solids handling).
• Maximum flow velocity to minimize erosion in pipes and fittings.
• Plant standards .
Decreasing piping diameter has the following effects:
• Component procurement and installation costs will decrease.
• Pump installation costs will increase as a result of increased flow losses with a subsequent requirement for higher head pumps and larger motors. Costs for electrical supply systems will also increase.
• Operating costs will increase, as a result of higher energy consumption due to increased friction losses.
The duty point of a pump is determined by the intersection of the system curve and the pump curve as shown in Figure 2.
Example
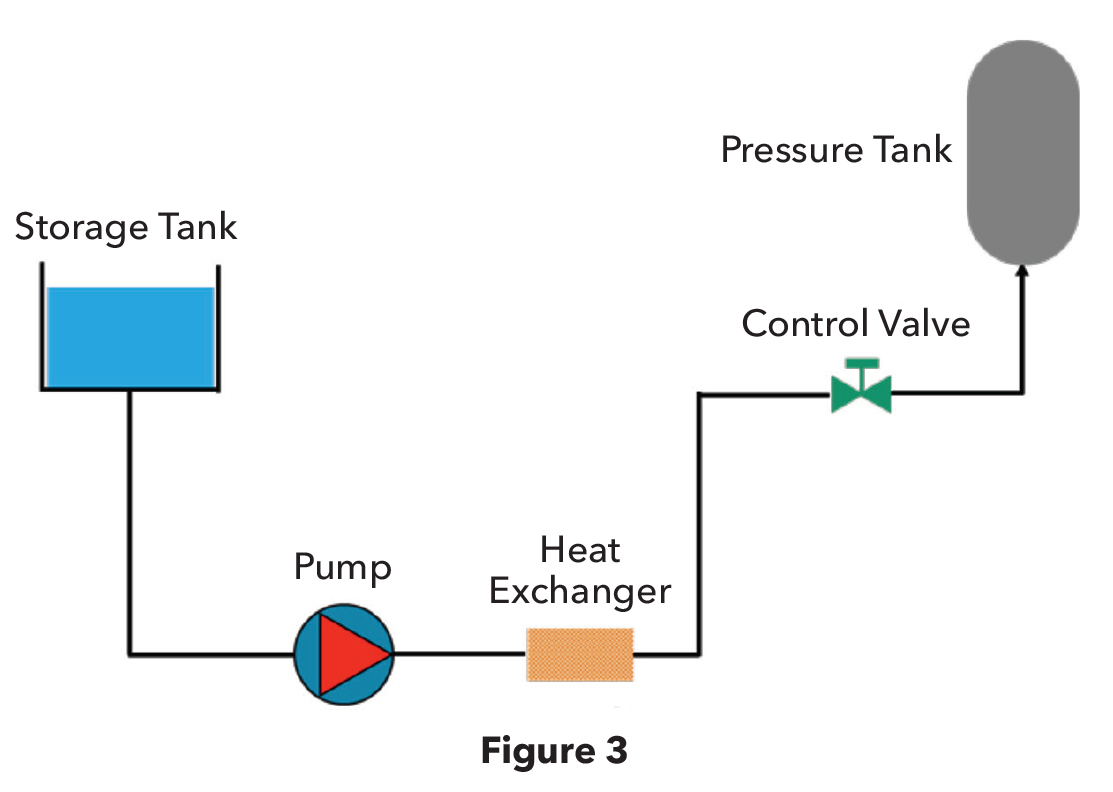
In this example, the LCC analysis of a single-pump circuit that transports a process fluid from a storage tank to a pressurized tank will be calculated. A heat exchanger heats the fluid and a control valve regulates the rate of flow into the pressurized tank.
The plant manager is experiencing problems with the control valve that fails every 10-12 months due to cavitation (the formation and implosion of air bubbles in the liquid, causing shockwaves to hit and damage the equipment), generating a cost of €4,000 per repair. During an inspection of the system, the pump service engineer discovered that the pump is oversized for the application.


